Appearance
Interactive Graph
For very large knowledge graphs, you have the option to use a interactive graph mode. This mode intelligently displays only the terms and relations that are currently relevant to your exploration.
You can activate this mode by navigating to .
Selecting What to Display
Once you've selected "Dynamic Layout," the entire graph will initially be hidden. You will see a search bar appear at the top, accompanied by several control icons.
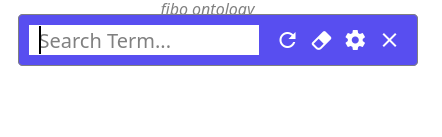
- Refresh: Redraws the currently visible terms and relations using the selected layout algorithm. This can be useful if the layout becomes cluttered or after making changes.
- Eraser: Hides all currently displayed elements (terms and relations) in the graph, giving you a clean slate to start a new exploration.
- Settings: Opens a configuration panel where you can choose the algorithm used to automatically arrange the visible terms and relations (e.g., Force-Directed, Hierarchical).
- Close: Exits the interactive graph mode and returns to displaying the entire static graph.
- Search box: Allows you to search for specific terms by name. When you find and select a term, it will be added to the dynamic graph, along with all terms and relations that are directly connected to it.
Expanding the Graph
The following example uses the FIBO (Financial Industry Business Ontology) dataset, which you can load via . In this example, the dynamic positioning setting is enabled, and the layout type is set to "Hierarchy" with the direction "Bottom to Top."
After you've added your initial term to the graph using the search box, you can continue to add more related terms by searching again.
Additionally, you can interact directly with the terms already displayed in the graph to expand their connections, as shown in the following image. Right-clicking on a term will open a context menu with expansion options.
Expand Options
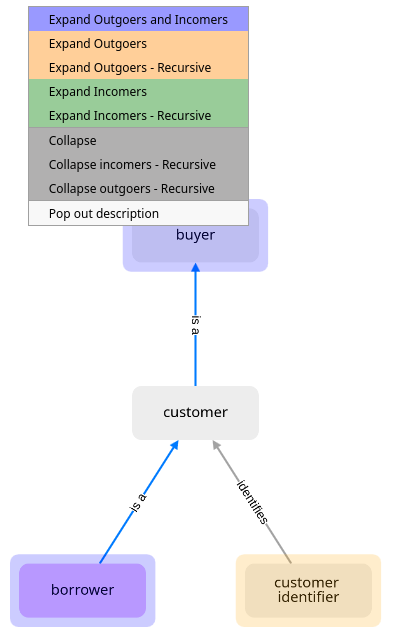
Each term in the dynamic graph has a subtle background color that provides a visual cue about potential further exploration:
- No background: This indicates that all direct relations connected to this term are currently visible in the graph; there are no more direct relations to expand.
- Purple background: This signifies that there are both hidden incoming and hidden outgoing relations connected to this term that can be expanded.
- Green background: This indicates that there are hidden incoming relations connected to this term that can be expanded.
- Orange background: This indicates that there are hidden outgoing relations connected to this term that can be expanded.
Right-clicking on a term will bring up the following consolidated context menu options:
- Expand ▸: Options to grow the graph from the selected term.
- Outgoers and Incomers: Displays all directly connected terms and relations.
- Outgoers: Displays only relations where the selected term is the source.
- Outgoers - Recursive: Recursively explores chains of outgoing relations.
- Incomers: Displays only relations where the selected term is the target.
- Incomers - Recursive: Recursively explores chains of incoming relations.
- Collapse ▸: Options to hide elements.
- Collapse: Hides the selected term and its immediate connections.
- Incomers - Recursive: Recursively collapses incoming connections.
- Outgoers - Recursive: Recursively collapses outgoing connections.
- More ▸:
- Open Description Panel: Opens a separate definition window for the term.
- Help: Access the user manual.
Relation Filtering
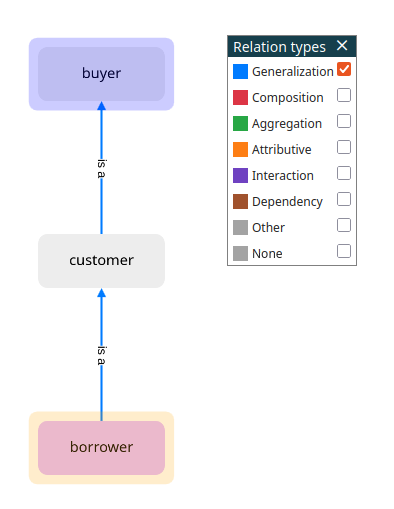
You have the ability to filter the displayed relations in the dynamic graph based on their type. For example, if you are primarily interested in hierarchical relations, you can choose to display only "Generalization" relations. To enable and configure this filtering, go to . This will allow you to select which relation types are visible in the graph legend, and consequently, which types are displayed.